|
||||||||||||||||||||||||||
|
||||||||||||||||||||||||||
|
This page shows typical evaluation examples of DNA family research results. The first two examples show results from FamilyTreeDNA. Graph 1 contains a list of all hits of a test-person (748) in the order of the total length of all common segments. In the present example, the mother of the proband is in the first place (3,384 cM), the 1st cousin in 2nd place (516 cM), and the 3rd cousins are on rank 3rd to 5th. In the second graphic, a last name is entered as a filter (eg “Rittme” for Rittmeyer and Rittmeier), according to which in this example 7 qualified persons are given who are related to the proband. |
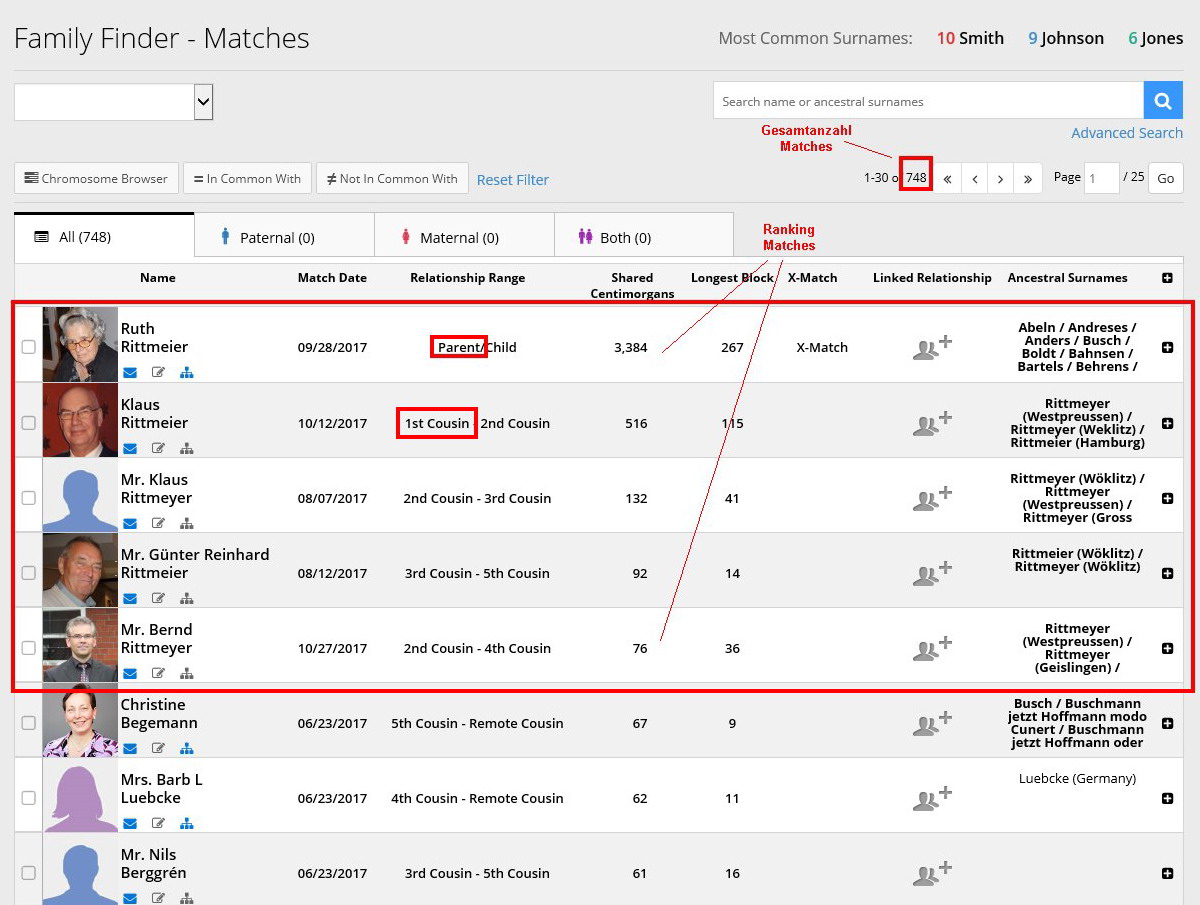 |
| Graphic 1 - Matches of a proband (output sort order kinship according to common segments) |
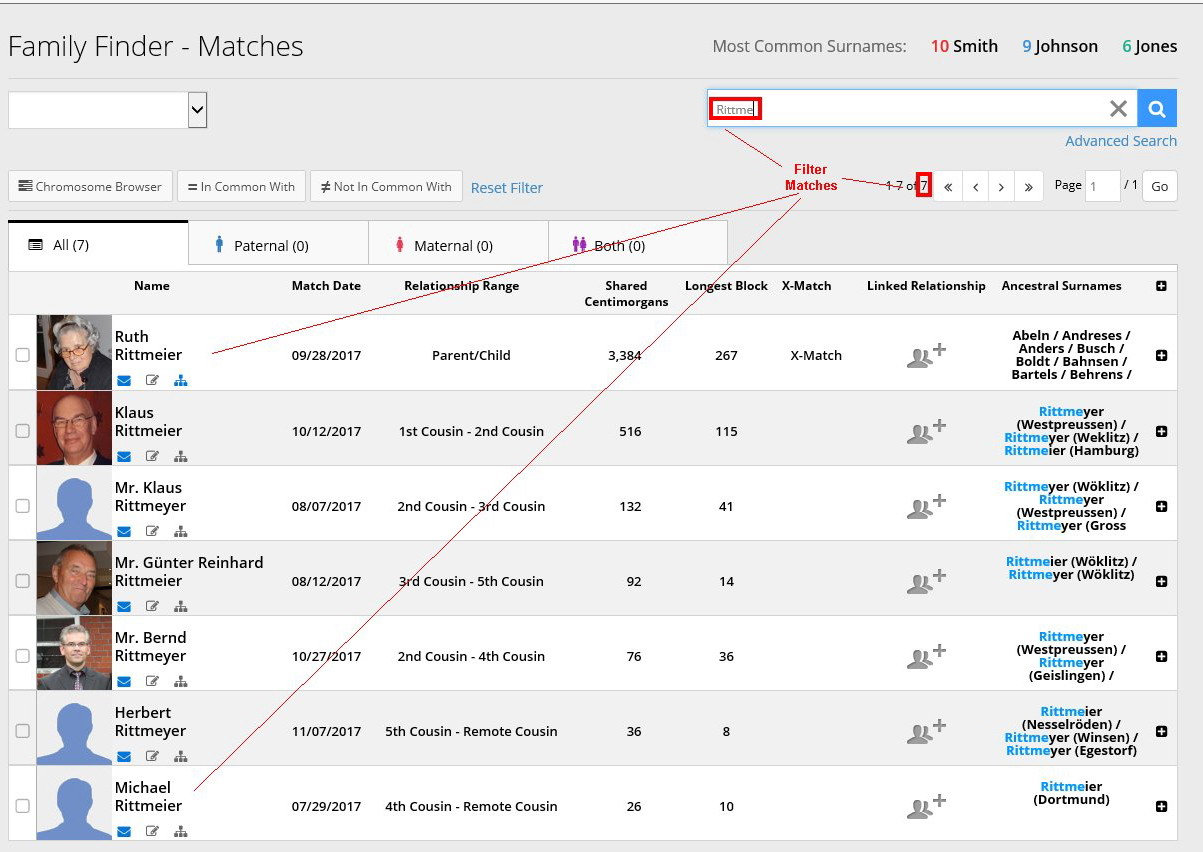 |
| Graphic 2 - Matches of a proband (filter by surname) |
|
Graphic 3 shows the origin of
the test-person according to his ethnicity (original nationality). In
the present example, 41% of the probands' ancestors come from the
British Isles, 22% from Scandinavia, 22% from Western and Central
Europe and 13% from Eastern Europe. |
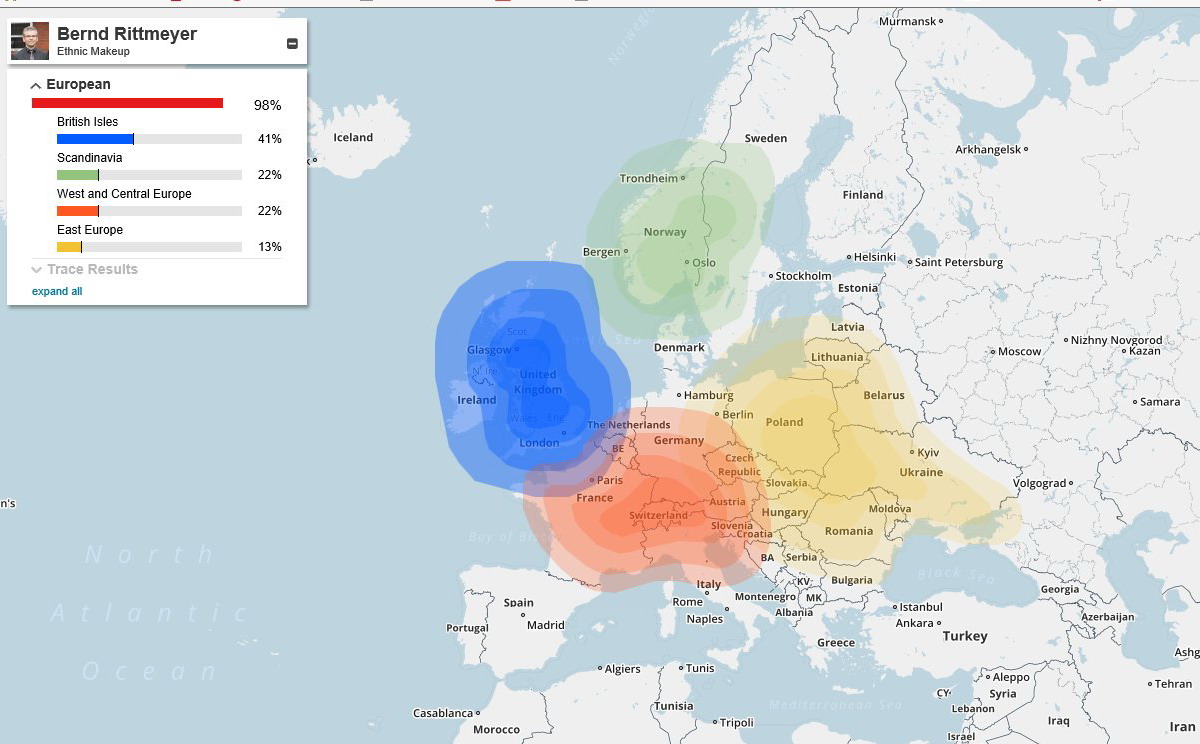 |
| Graphic 3 - Origin of the proband (original peoples) |
|
Graphic 4 provides an overview
of the number of common segments and total length of all common
segments between selected persons. The evaluation suggests that the
first 5 person, all descended from ancestors from West Prussia, are
related to the last two persons whose ancestors came from
Nesselröden (Lower Saxony). |
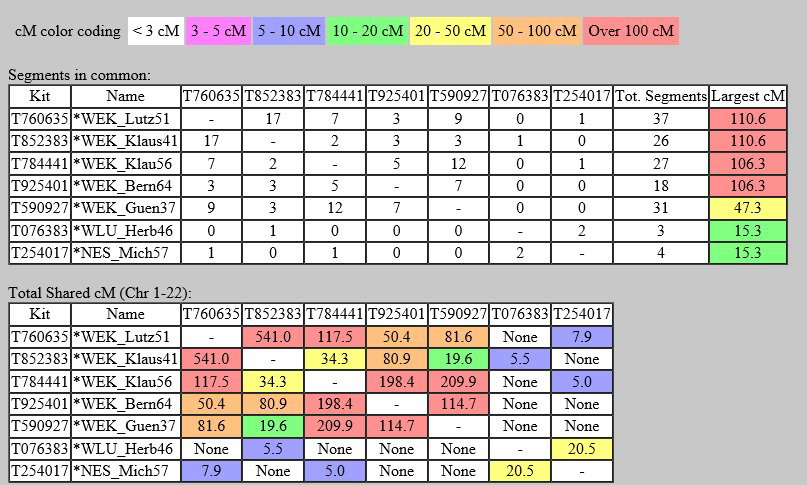 |
| Grafik 4 - Matrix of family relationships |
|
|
|
© 2021 www.familien-nachforschung.de.
All rights reserved. All statements without guarantee. |